

Solution · Electric bus transition
Size the electric fleet before you buy it.
A battery turns a vehicle schedule into an energy, charger and depot problem. Blixar solves them together, from the timetable you run today, so the business case is the difference between two checked plans rather than a safety margin.
The problem
Most fleets are sized with a 10–20% safety margin.
Because energy is checked after the schedule is built, not inside it. A plan that was tight on diesel needs twenty extra buses at 17:15, and the only defence is to buy more buses and more chargers than the timetable needs.
The questions your board is asking
- How many electric buses does this timetable really need?
- How many chargers, of which kind, at which depot and terminal?
- What peak power must the grid connection carry?
- Which routes suit which bus type and battery?
- Which depot should each route run from?
- What does it cost against the diesel fleet we run today?
The energy model
Energy, chargers and depots planned inside the block.
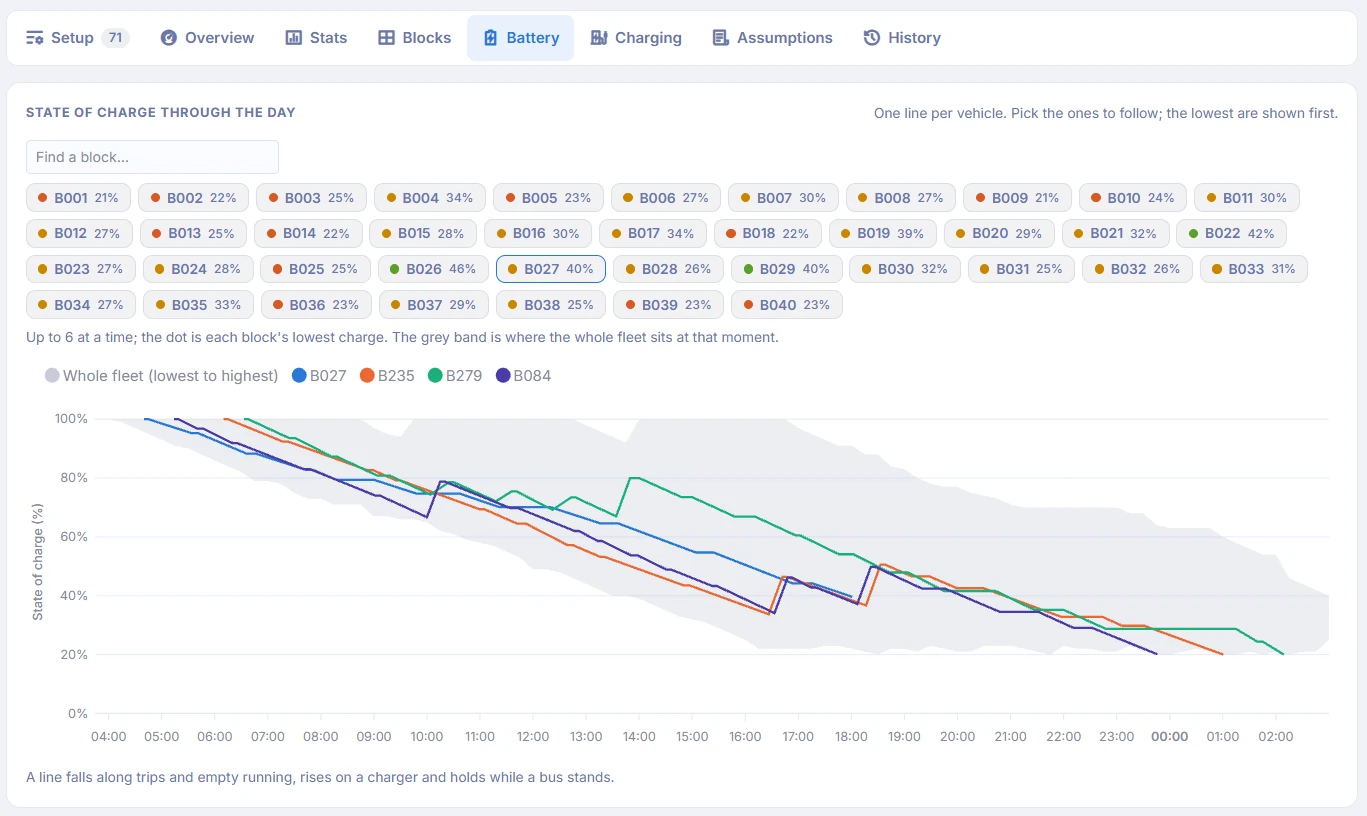
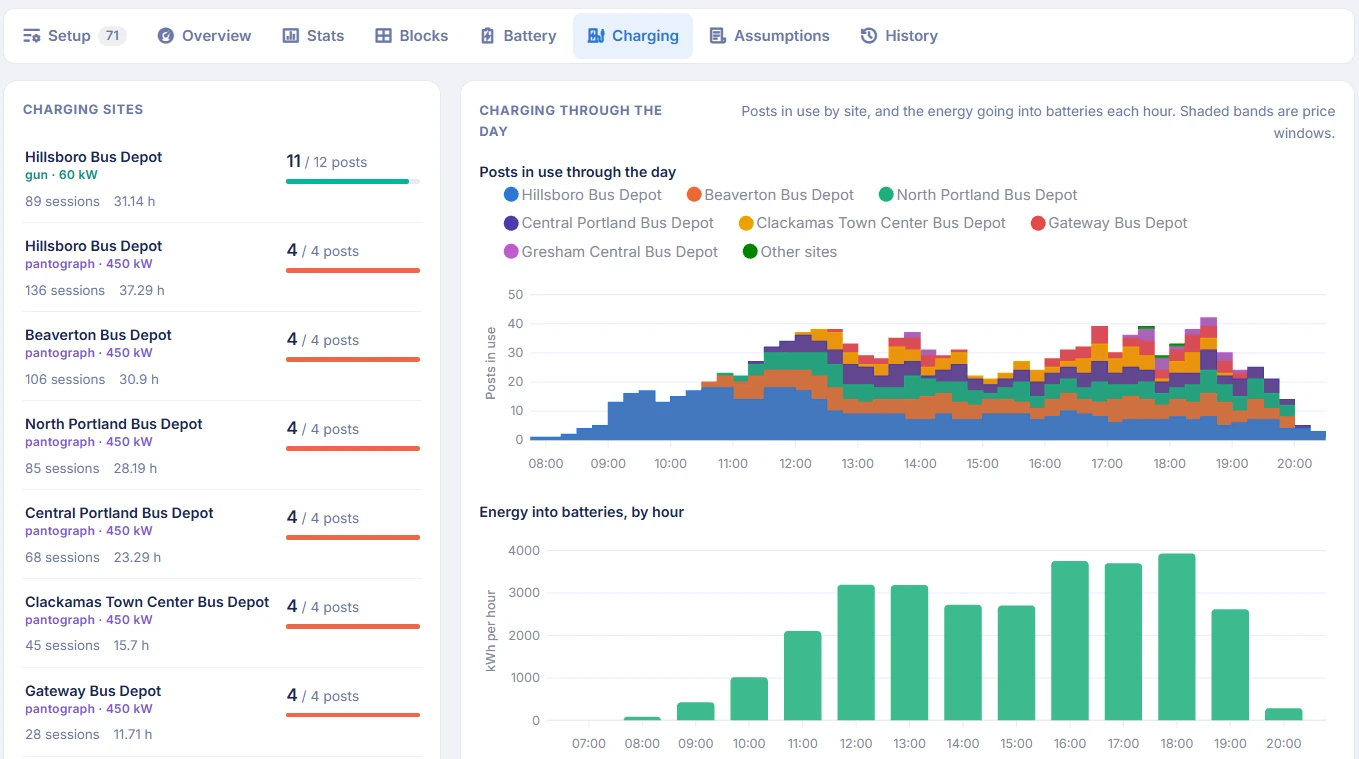
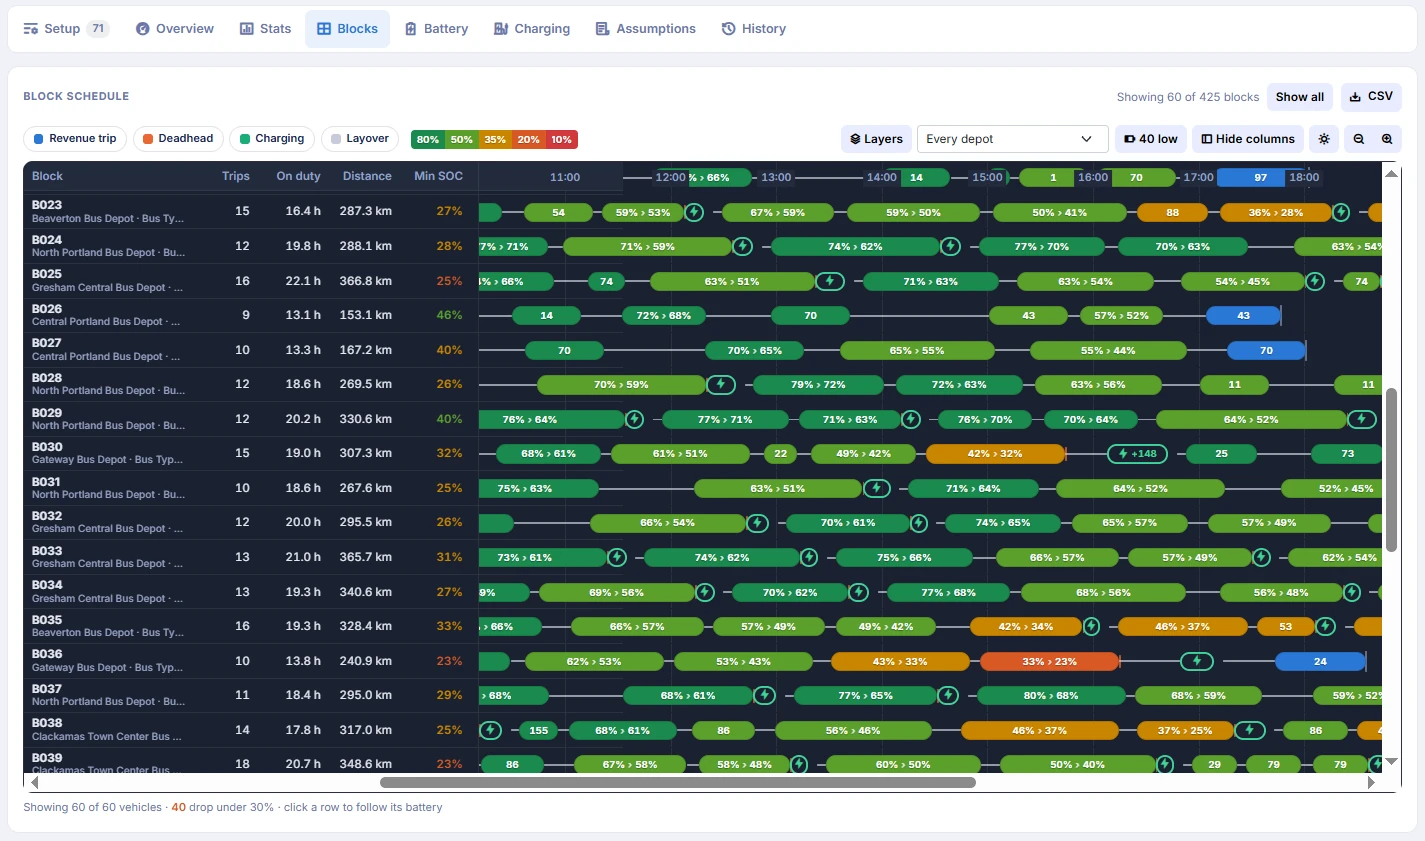
An electric timetable is not a diesel timetable with a range limit. Blixar models the energy of every trip and deadhead, the state of charge of every bus through the day and the posts at every charging site.
Two kinds of charger, counted separately
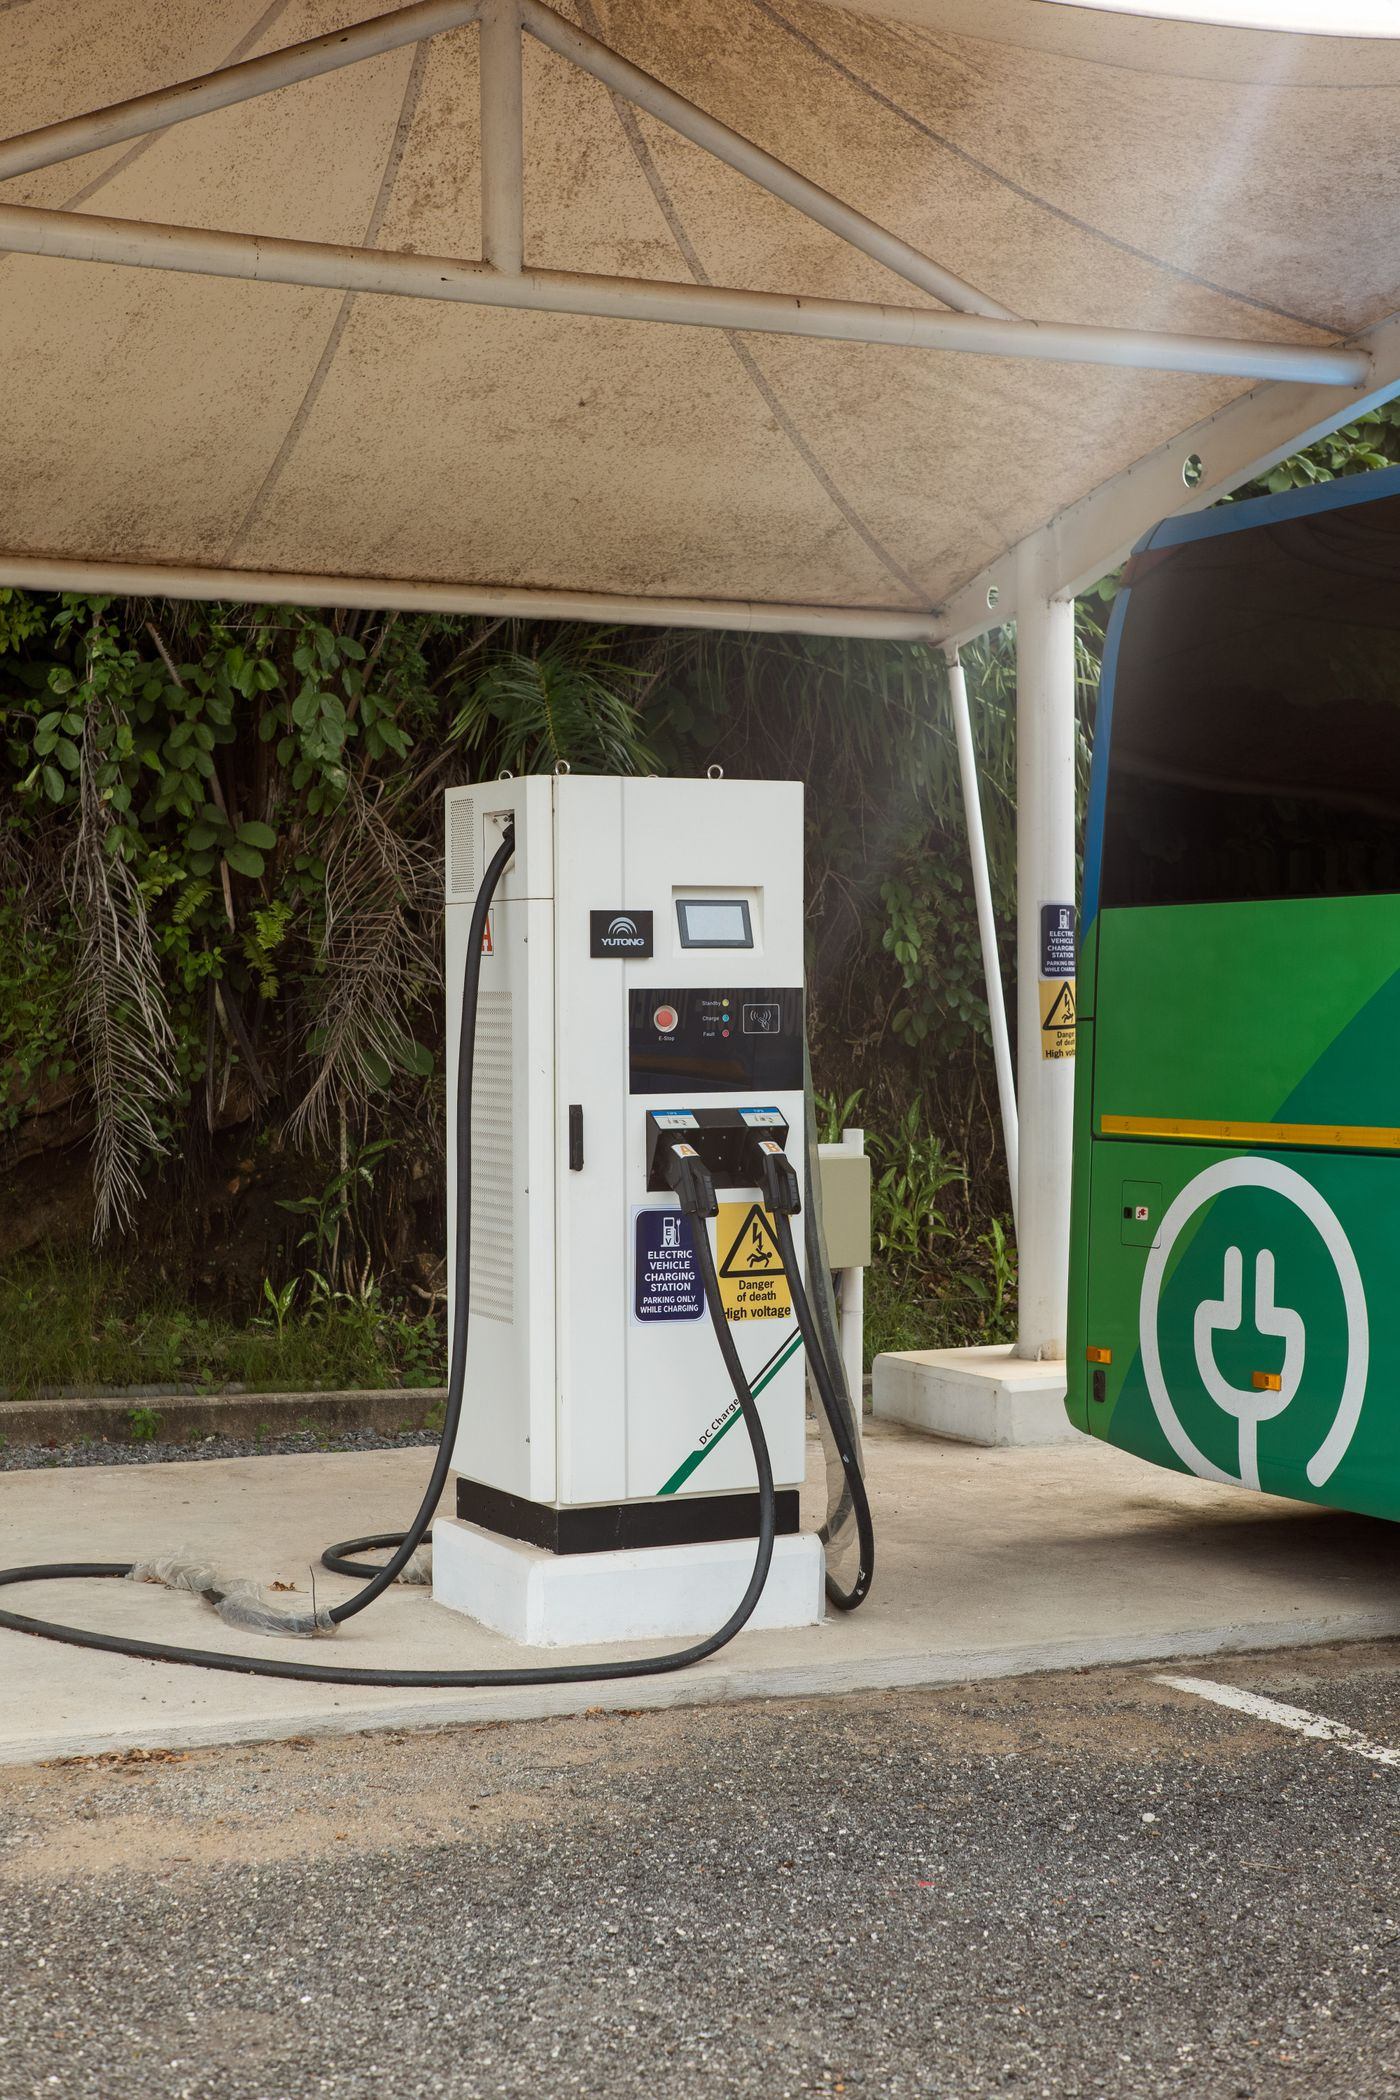
Depot guns and terminal pantographs have their own power, count and queue. A bus that arrives behind another waits for a post or moves on; a busy post is never treated as no post.
Seasonal consumption
Air conditioning in a Gulf summer and heating in a European winter change the range. Consumption is carried by season, and the solver plans against the season being scheduled.
Charge where the gap is
The solver finds charging windows inside layovers rather than only at arrival, so a morning bus can top up for the evening peak instead of a spare pulling out of the depot.
Depot and bus type per route
Let the engine decide which routes suit the longer-range class and which depot each should run from, then read what that decision is worth in buses and kilometres.
The method
A business case built on two checked plans.
- 1
Baseline the diesel plan
Rebuild today’s vehicle schedule and check it against the timetable’s lower bound. On our 1,545-trip benchmark depot the answer meets the floor of 124 buses exactly.
- 2
Solve the same timetable electric
Add candidate bus types, battery sizes, chargers and depots. The electric plan is judged against the same floor, so the extra buses electrification costs are visible and argued.
- 3
Compare scenarios
Clone and vary one thing at a time: more pantographs at a terminal, a larger battery, a second depot. Each run reports fleet, chargers, energy and peak power side by side.
- 4
Carry it into crew and operations
The chosen plan flows straight into duties, rosters and daily operations, and telematics measures real consumption to tighten the next season’s plan.
What would it cost to run your timetable electric?
Send us a GTFS feed or a timetable and your candidate bus types. We will run the diesel baseline and the first electric scenario with you.