

NPAtlas · Network Planning & Analysis
Should we change the routes themselves?
Atlas is a planner for bus networks, organised as one menu down the left of a live map. Its Network Planning menu plans and restructures routes across the network, in four groups by what is being changed: the network's structure, the design of a route, its stops, and the scenarios that compare them.
- planning groups
- 4
- Network Planning menu items
- 11
- months of ridership averaged
- 3
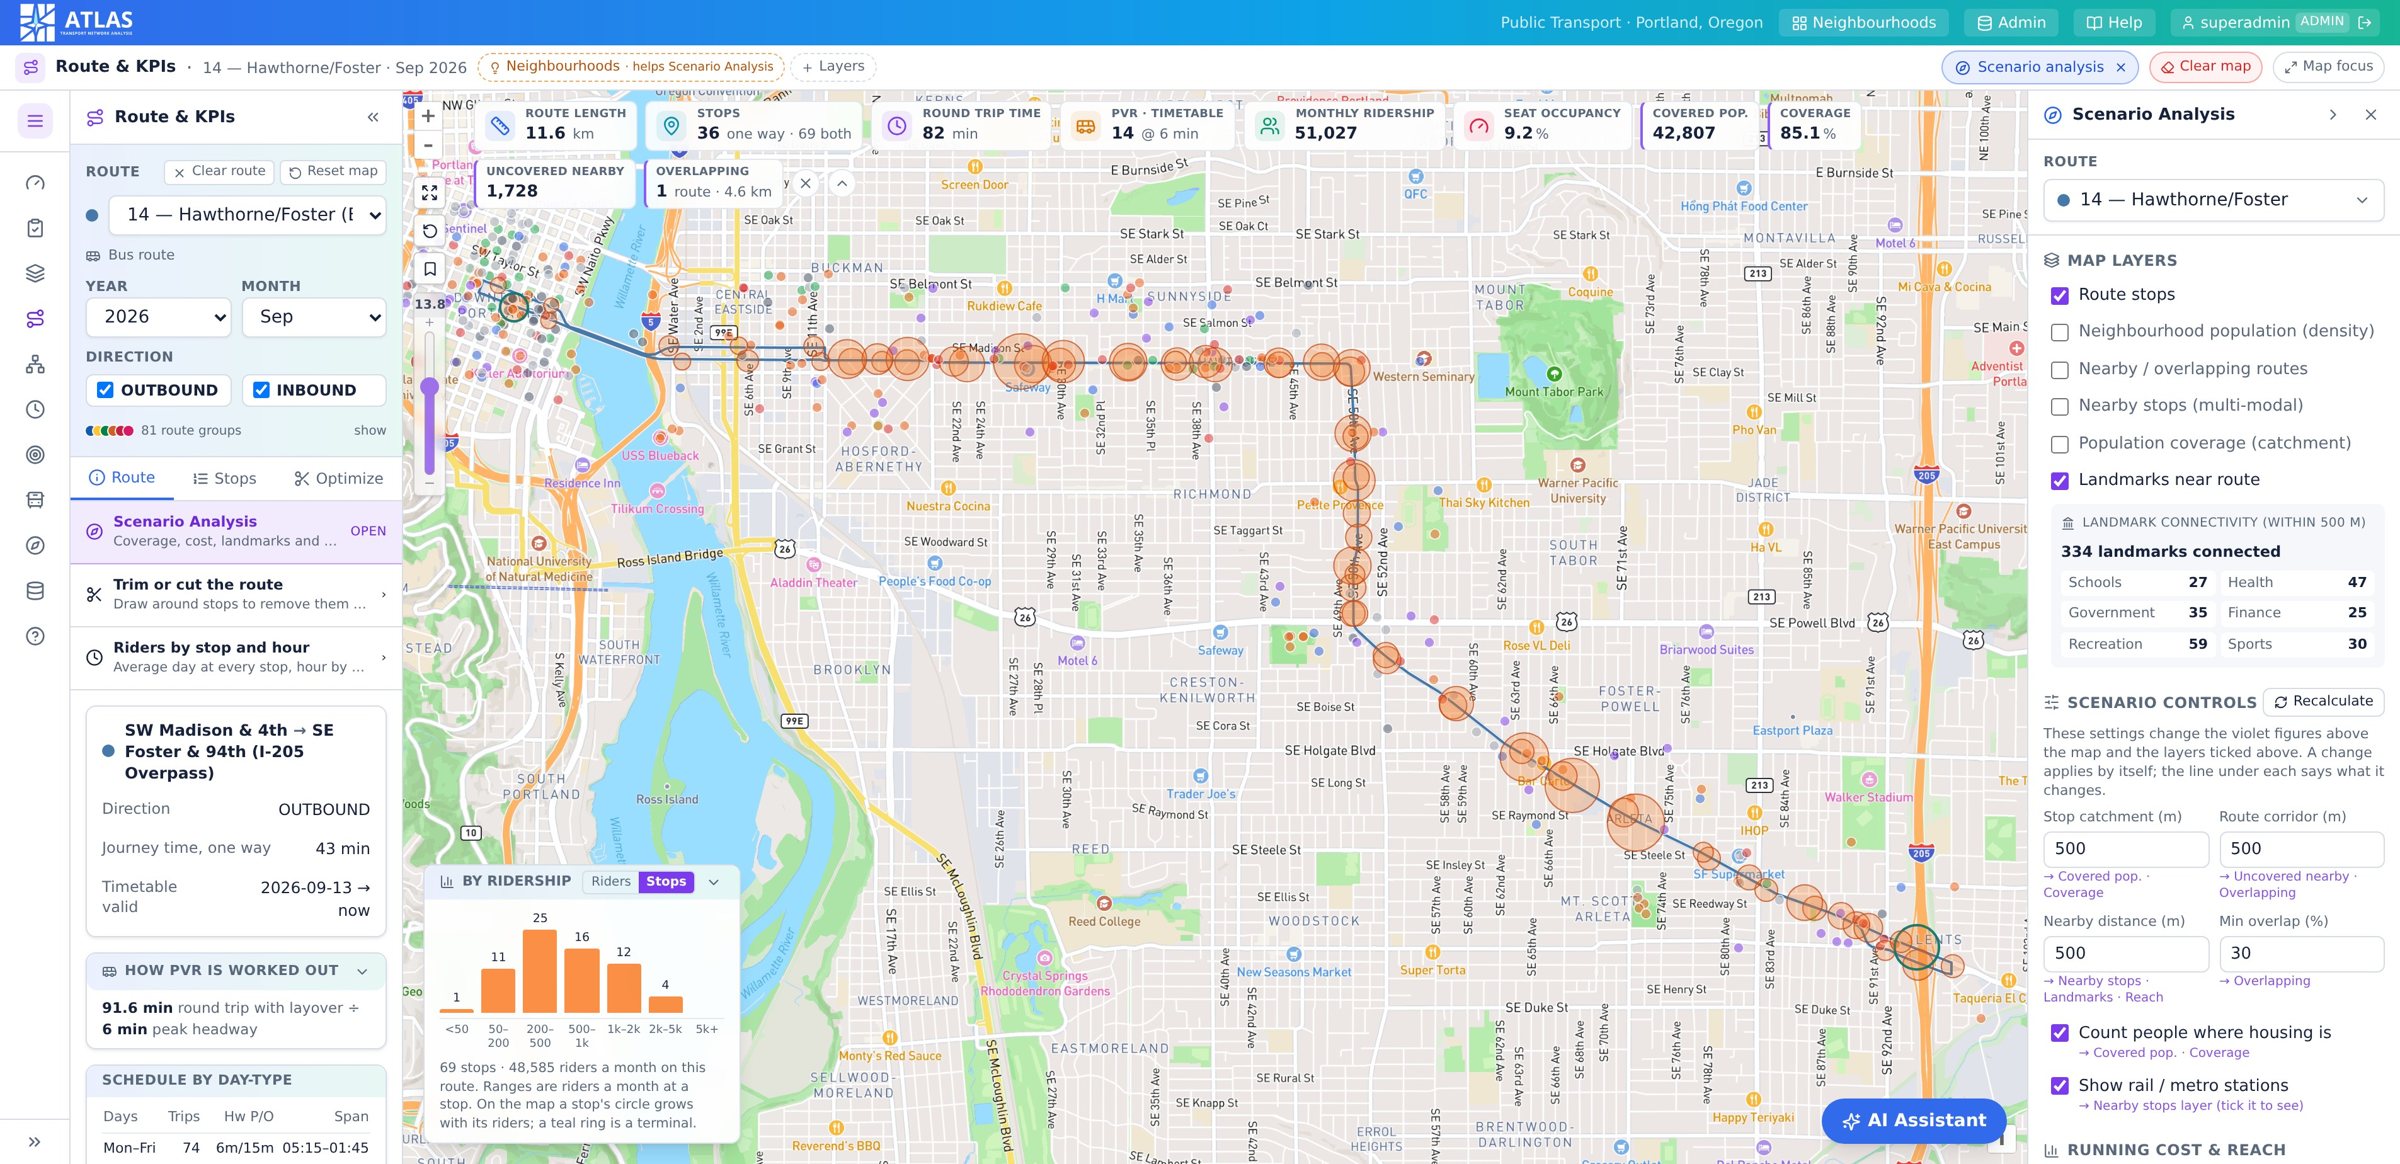
The menu, item by item
Every question a planner asks has a place in the menu.
The planner follows the menu on the left, top to bottom. The app opens on the Dashboard: the network in numbers.
Dashboard
The network in numbers. What the planner opens on.
Network Review
Where the problems are, next in the menu after the Dashboard.
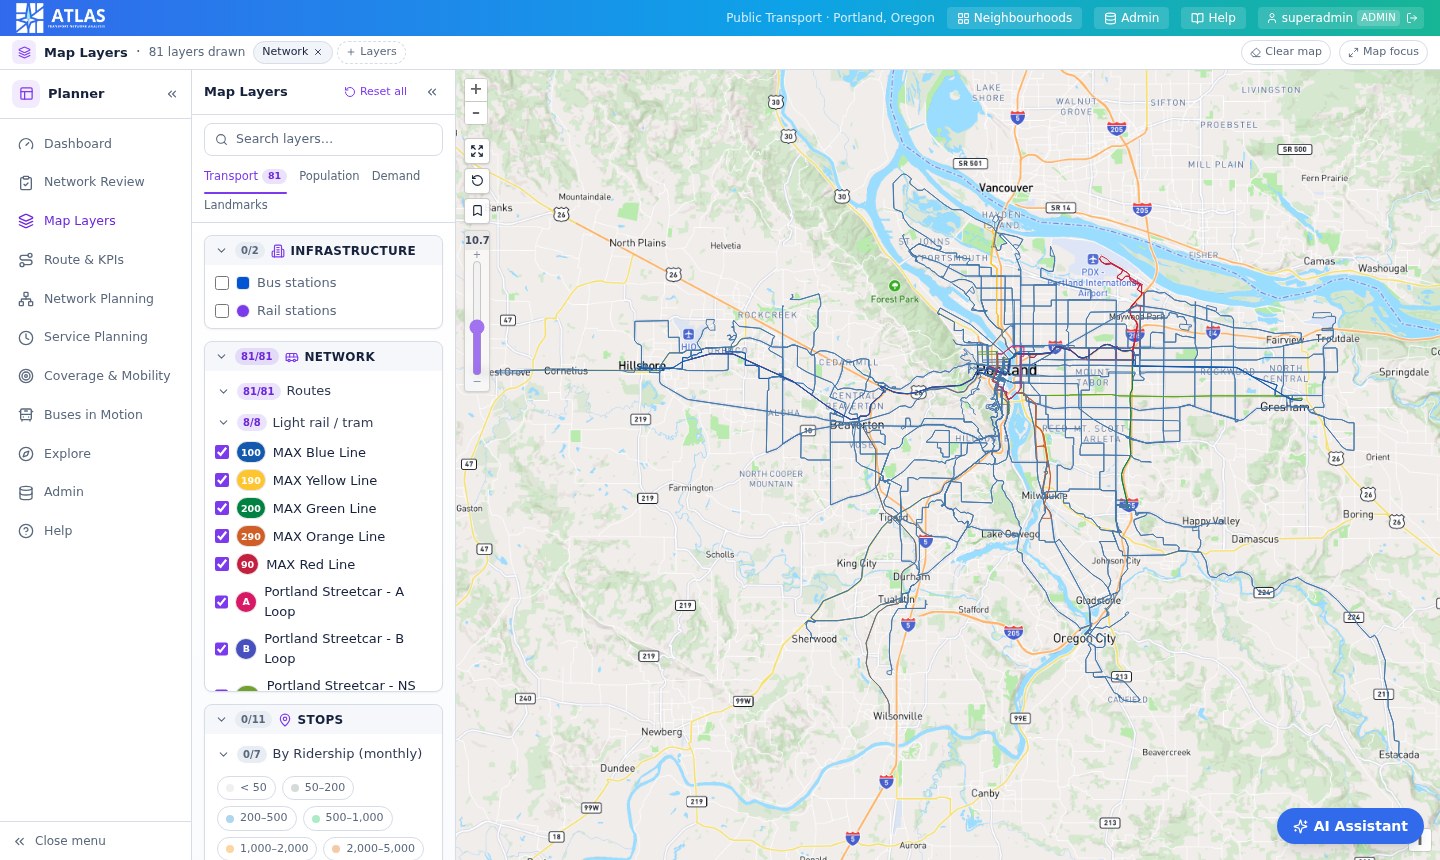
Map Layers
What is where? Tick what you want drawn on the map.
Route & KPIs
How is this route performing? Pick one route and everything is about it.
Network Planning
Should we change the routes themselves? The analyses, and building a route by hand.
Service Planning
How much service should we operate?
Coverage & Mobility
Where are the gaps, and what kind of service belongs there?
Buses in Motion
Watch a day of the timetable run on the map.
Find routes & stops
What serves this place? Search by station, stop or a drawn area.
How the numbers are worked out
PVR, ridership, coverage and the other rules behind the figures.
The planner screen
A menu, a panel and the map.
| Top bar | The city, Help, your name and sign out. Admins also see Districts and Admin. |
| Title bar | Names the menu item you are in, lists the layers that are on as chips, and carries a chip for every tool left open. |
| Left menu | The menu items, starting with the Dashboard. The ☰ at the top shrinks it to icons. The « on a panel hides that panel. |
| Panels on the right | Belong to the tool you opened. Each has an arrow that folds it to a strip at the edge. Clicking the strip brings it back. |
| Map focus | In the title bar. Folds every panel away and gives the map the screen. Press it again to bring them back. |
- Click a stop, station, district or landmark for a card with its details
- Fit zooms to whatever is highlighted, or to the whole network when nothing is
- Clear map removes what the analyses drew, so each analysis starts clean
- Viewers have the planner and every analysis; admins also save routes and settings
- The AI Assistant answers questions about routes, stops, ridership or coverage in plain words, from the same data as the screens
Network Planning
Four groups, by what is being changed.
This menu plans and restructures routes across the network. Group Optimization is the largest item: route merging, safeguards, areas you draw on the map, and results you can export.
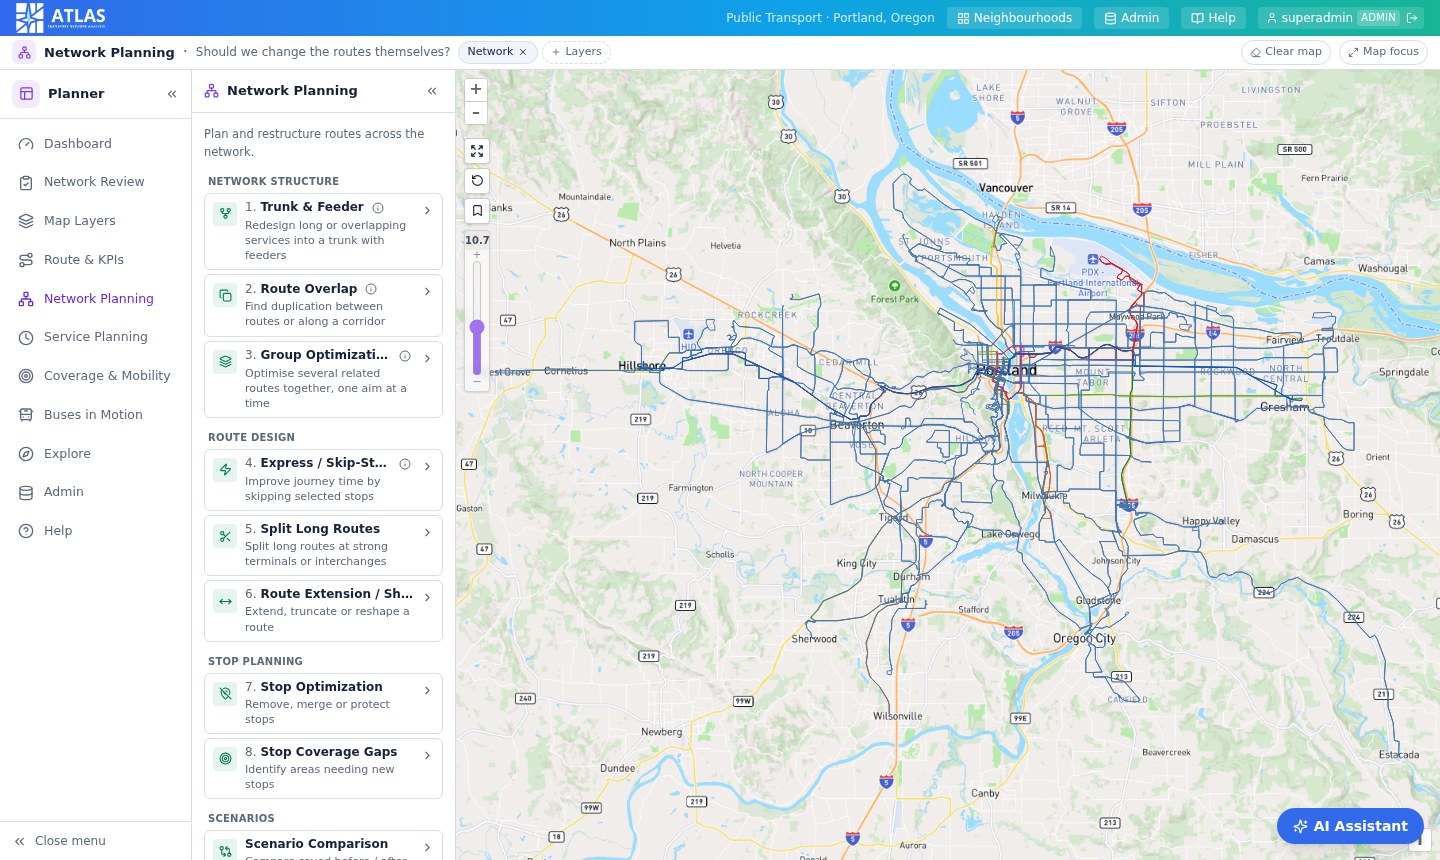
| Menu item | Purpose | Works on |
|---|---|---|
| Network structure | ||
| 1. Trunk & Feeder | Redesign long or overlapping services into a trunk with feeders | Route family / network |
| 2. Route Overlap | Find duplication between routes | Two or more routes |
| 3. Group Optimization | Optimise several related routes together, one aim at a time | Route group / corridor |
| Route design | ||
| 4. Express / Skip-Stop | Improve journey time by skipping stops | Usually one route |
| 5. Split Long Routes | Split long routes at strong terminals or interchanges | One route |
| 6. Route Extension / Shortening | Extend, truncate or reshape a route | One route |
| Stop planning | ||
| 7. Stop Optimization | Remove, merge, relocate or protect stops | Stops |
| 8. Stop Coverage Gaps | Identify areas needing new stops | Geography / population |
| Scenarios | ||
| Scenario Comparison | Compare saved before / after scenarios side by side | Saved scenarios |
| Saved Recommendations | Every scenario run so far, to reopen, rename or export | Saved scenarios |
| Recommended Plan | One recommended action per route, from every analysis together | Whole network |
The analyses
Each result is a card with a recommendation.
Analyses have a result panel of their own. Links open the tool that already does the job, so nothing exists twice.
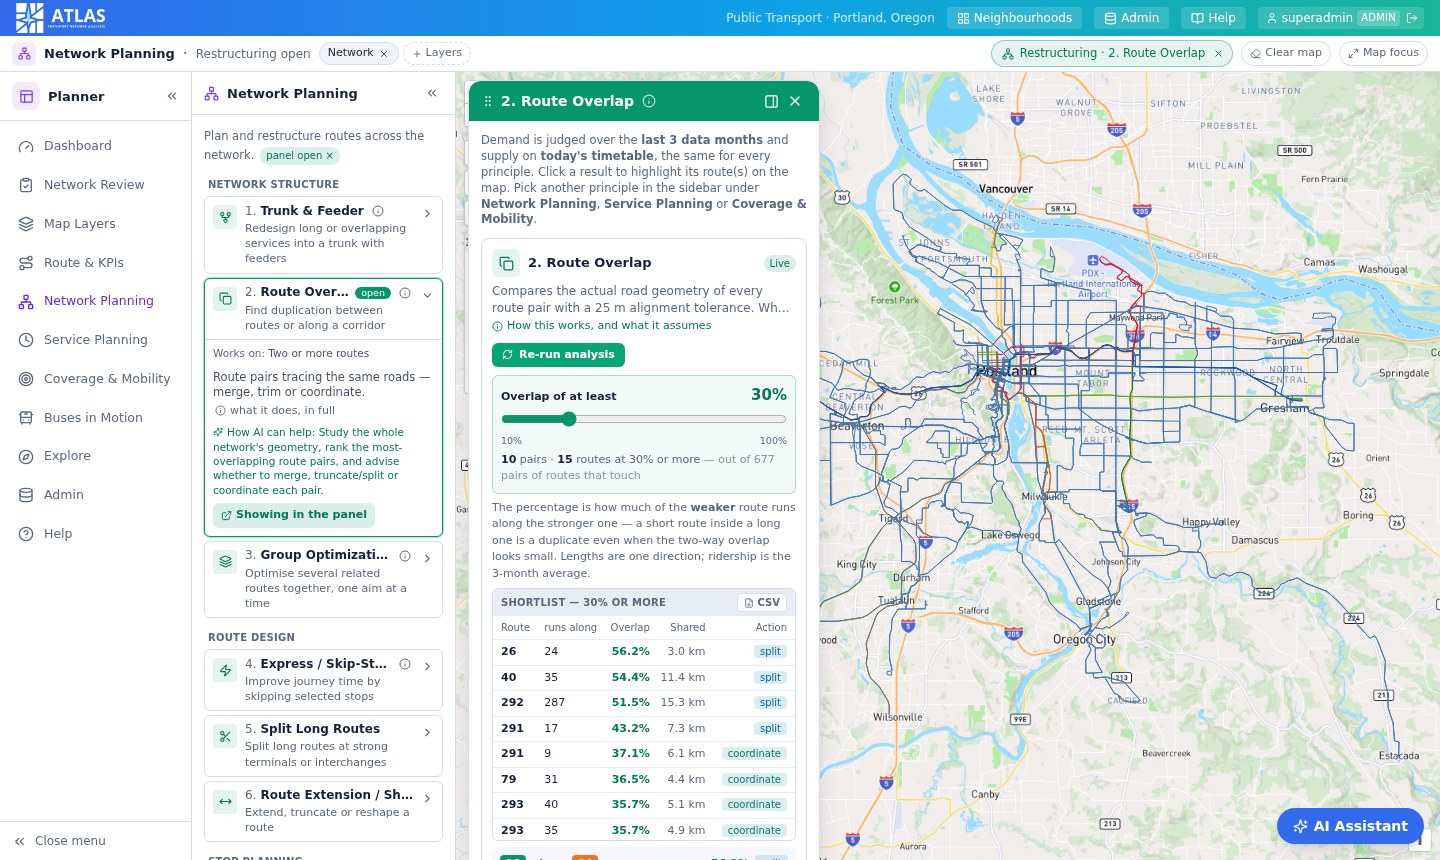
Route Overlap
Find duplication between routes or along a corridor.
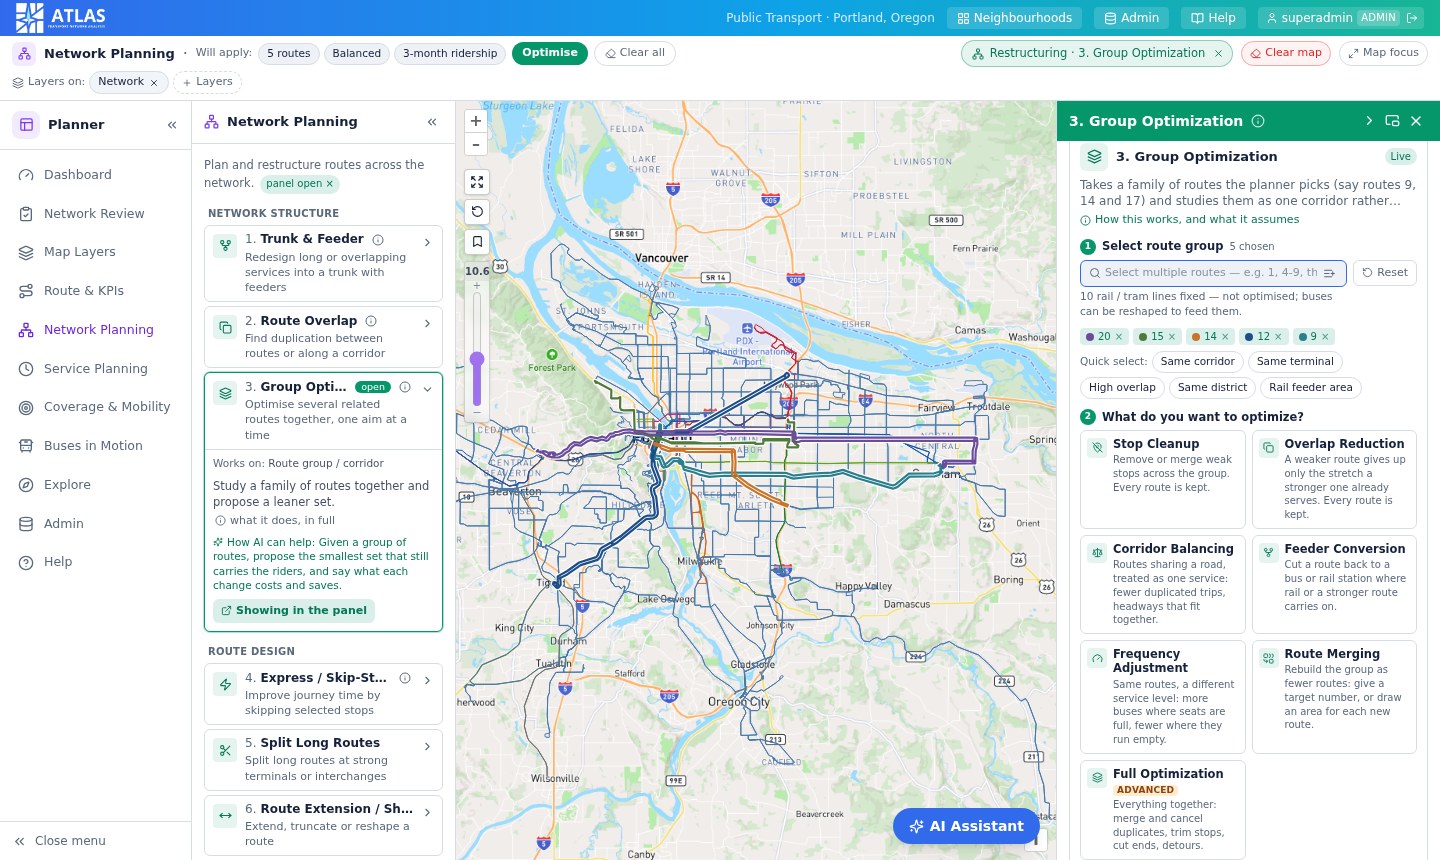
Group Optimization
Optimise several related routes together, one aim at a time.
Trunk & Feeder
Redesign long or overlapping services into a trunk with feeders.
Route Merging
Rebuild a group of routes as fewer routes.
Safeguards and areas
What a run may not touch, and areas you draw on the map.
Express / Skip-Stop
Improve journey time by skipping selected stops.
Split Long Routes
Split long routes at strong terminals or interchanges.
Scenario Comparison
Compare saved before / after scenarios side by side.
Which item do I need?
Start from the question.
| The question | Start with |
|---|---|
| Which routes are doing the same job? | Route Overlap for shared road, Trunk & Feeder for shared stops |
| How do I slim down this corridor? | Group Optimization |
| Can these five routes become two? | Route Merging |
| Is this route too slow or too long? | Express / Skip-Stop, Split Long Routes |
| I want to cut this route back, or draw a new one | Route Extension / Shortening |
| Which stops could go, and which must stay? | Stop Optimization |
| Where are stops missing? | Stop Coverage Gaps |
| Which of my scenarios is best? | Scenario Comparison |
| What should be done with each route? | Recommended Plan |
How every analysis works
Four steps, the same every time.
01
Read what it does
Open a card in the menu to read what it does. The ⓘ gives the full explanation of the method.
02
Open the analysis
The result panel opens docked on the right of the map, or floating over it. Opening an analysis clears the map, so what you see is only what this analysis draws.
03
Run it
Each result is a card with a recommendation.
04
See it on the map
Click a card to see it on the map. Click it again to clear it.
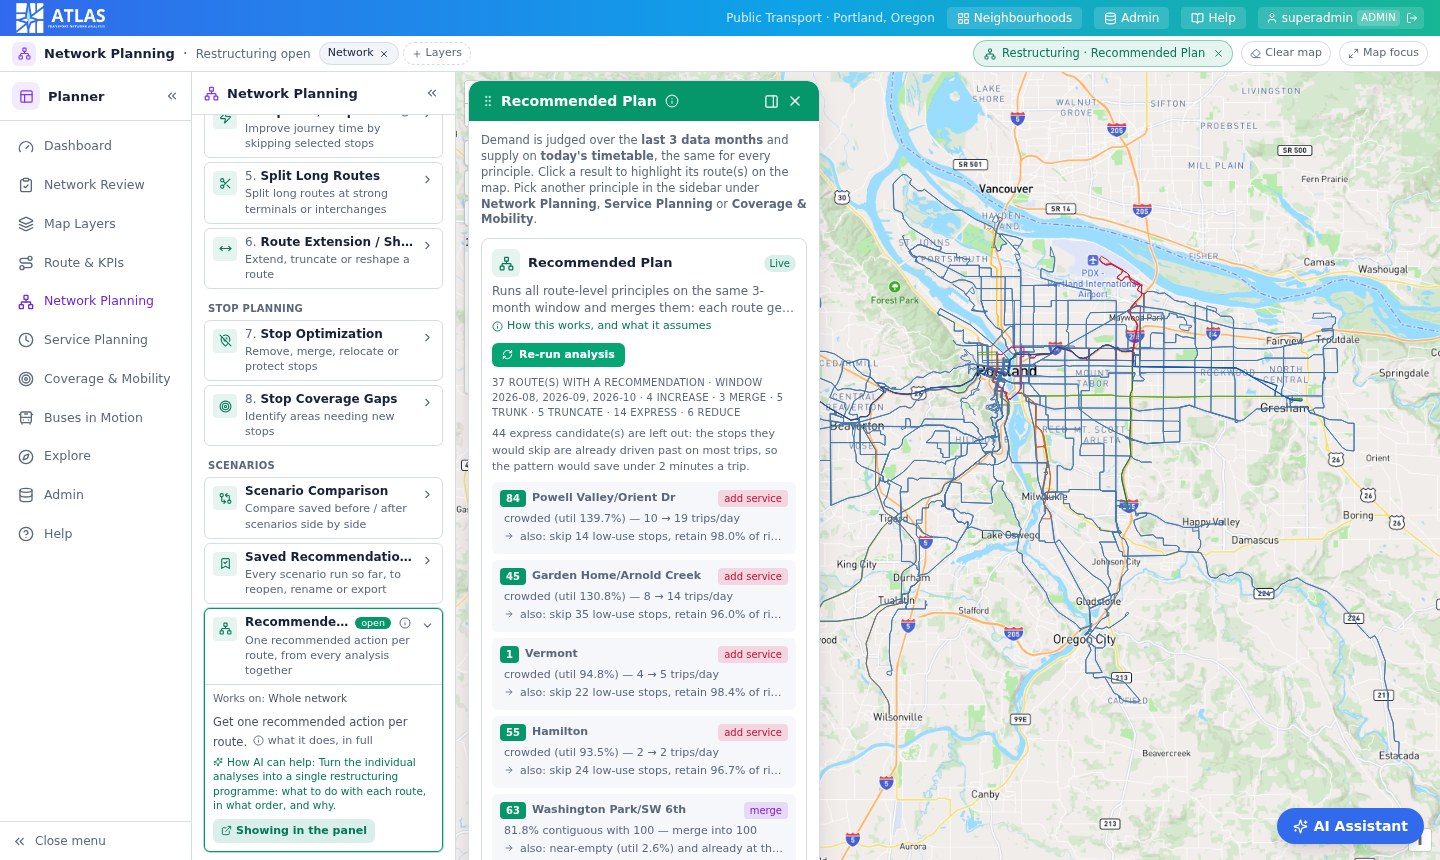
Ridership is averaged over the last three months of data, and supply is today's timetable. Rail lines and stations are treated as fixed: the analyses change bus routes only, and can turn buses into feeders for rail.
See it run on your network.
Bring a schedule feed, an alignment export and a few months of ridership. A walkthrough starts with your corridors and your questions, not a demo dataset.